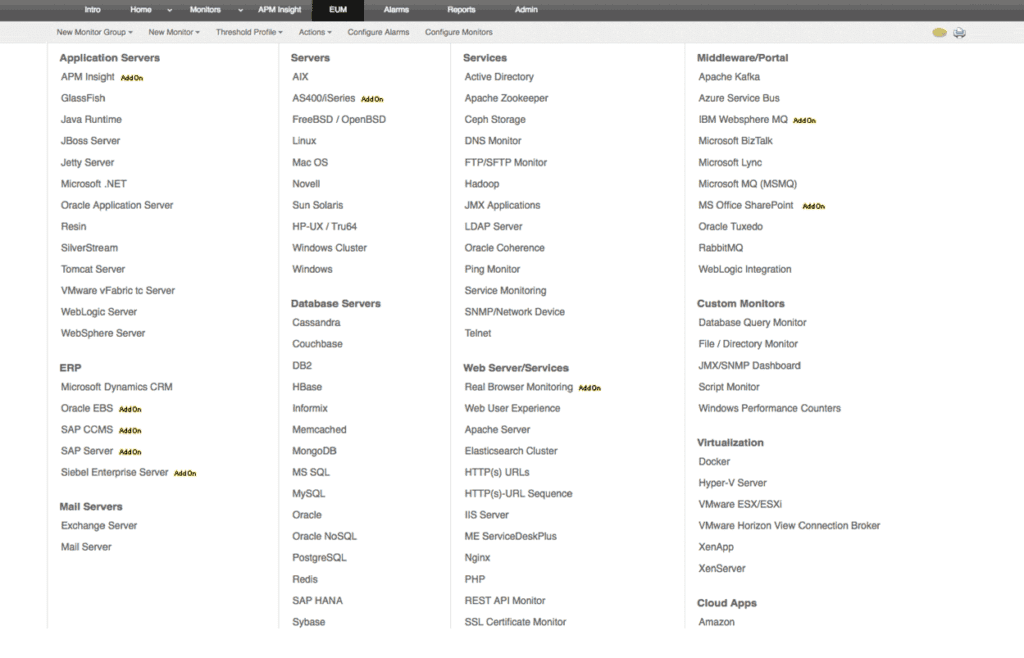
Server, Virtualization or Cloud
Single console for heterogeneous application monitoring
- Single, integrated application performance monitoring for all your server and application monitoring needs.
- From server and infrastructure components that support your business to all business critical applications responsible for uninterrupted service delivery, measure the performance statistics in real time for comprehensive application monitoring for your IT Operations.
- Unlike other application monitoring tools, Applications Manager supports the widest range of over 100 popular technologies across server, virtual machines, cloud applications, application servers, databases, big data stores, middleware & messaging components, web servers, web services & ERP suites.
- Built for today’s complex, dynamic application performance management needs.
- Application monitoring software even for homegrown apps with custom scripts.
- Enterprise Application Monitoring tool that can scale up to 50,000 applications.
- Get started in minutes. Easy setup, no training or consultation required to get your application monitor started.

See how your databases perform
- Get comprehensive insight into the health and performance of your databases using agentless methodologies.
- Track slow queries, expensive statements, response times, failures, page faults, and a whole lot of KPIs.
- With ManageEngine’s application monitor, easily identify and solve database issues that impact application performance.
- Out-of-the-box support for:
– JDBC databases – Oracle, MS SQL, MySQL, IBM Informix, IBM DB2, Sybase, PostgreSQL.
– NoSQL technologies – MongoDB, Cassandra, Couchbase, Apache HBase, Oracle NoSQL.
– Big data stores – Hadoop.
– In-memory databases – Redis, Memcached, SAP HANA, Oracle Coherence.
Application Monitoring with transaction level insights
Code-level diagnostics for Java, .NET, Ruby on Rails, Node.js, .NET Core and PHP applications.
Track response times with code-level information about your web application monitoring environment.
Perform thorough web application monitoring and pinpoint erroneous methods in your application stack with method-level application monitoring. Drill down to see the performance impact of specific code segments and SQL statements.
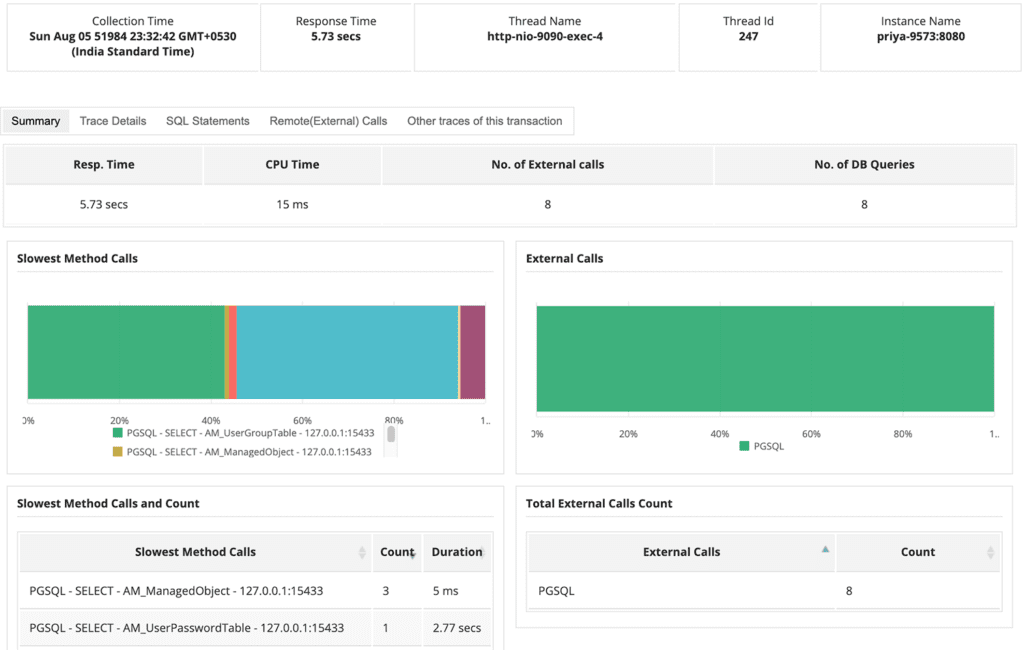
Detect slow transactions with transaction tracing
Get the exact invocation pattern and details of transactions across your application environment. Detect slow transactions and find out why they are slow.
Monitor database query executions
Track and inspect all SQL and NoSQL queries sent by your application. Identify slow database calls, long running queries,and overall performance of the database.
Track background transactions with in-depth business application monitoring
Measure response time of non-web/background transactions, the ones that are spawned in the background threads to understand how your database responds to queries.
Evaluate end-user satisfaction levels with Apdex results
Keep track of the prior and subsequent effects of your application optimization efforts. With our excellent application monitoring software, ensure a perfect end user experience.
Measure end-user satisfaction Levels with Apdex Scores
Track the before and after effects of your application optimization efforts. With our optimal application monitor software, ensure seamless end user experience.
Application monitoring for web servers/services
With our web application monitoring software :
- Keep an eye on the performance of your web servers, web services, and caching layers in the context of the business applications they support.
- Get instant notifications when there are problems.
- Identify root cause of application problems quickly and take corrective measures before your end user experience is affected.
- Supports Microsoft IIS, Nginx, SOAP web services, Apache, PHP, REST API services, Apache Solr server, HTTP(s) urls, URL sequence, etc.


Monitor Application Server Performance
Ensure the performance of your business application is not affected by infrastructure issues.
- With our comprehensive server and application monitoring tool, get deep visibility into the health and total performance of all the underlying components of your IT environment.
- Understand key performance indicators including resource usage trends such as CPU and memory usage from your application monitor. Application monitoring software with visibility into the processes running, JVM usage, and more.
- Proactively troubleshoot application server issues before they affect the performance of your business application.
- Our server and application monitoring software also provides out-of-the-box support for Oracle WebLogic, IBM WebSphere, JBoss, Tomcat, Microsoft .NET, Oracle AS, GlassFish, SilverStream, VMware vFabric tc Server, Wildfly, Jetty, and Resin.
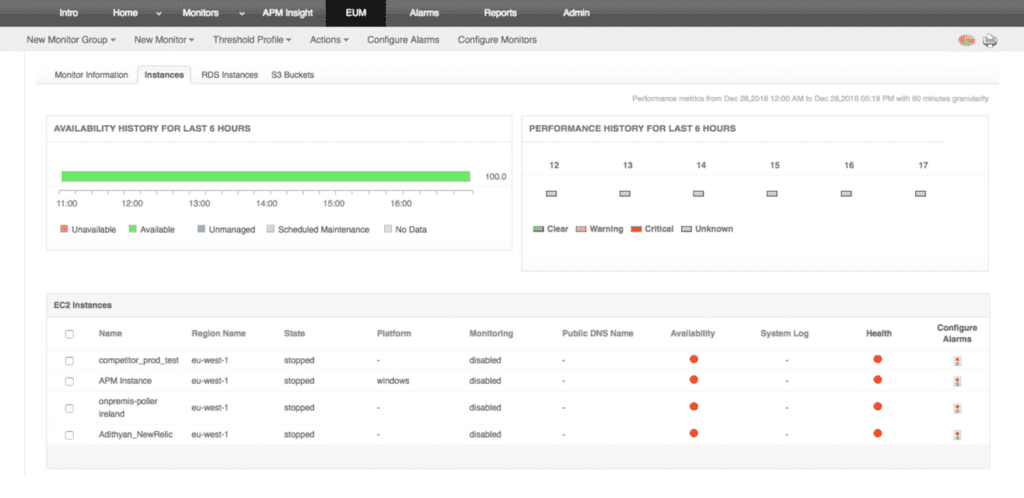
Cloud, Container and Infrastructure Monitoring
Optimal application monitoring tools should provide complete visibility into your cloud environment. Our cloud application monitor software will help you :
- Monitor your entire stack including private, public, and hybrid clouds, as well as critical cloud-hosted applications. Get out-of-the-box application monitoring support for public cloud platforms such as Amazon AWS, Windows Azure and OpenStack.
- End-to-end monitoring of virtualized environments in your private data center. With our application monitoring software, get real insight into the performance of virtual technologies from:
- VMware – ESX/Esxi, vCenter, Horizon View
- Citrix – XenApp, XenServer
- Microsoft – Hyper-V
- Gain visibility into containers such as Docker and microservices.
- Get insight into resource utilization in virtualized environments and plan capacity effectively.

Monitor Middleware & Messaging Components
- Identify performance hotspots and deployment issues in your enterprise technologies such as middleware and messaging components, as well as packaged applications such as ERP.
- Our robust enterprise application monitoring software will help you resolve problems faster and ensure optimal performance of your complex middleware technologies.
- Out-of-the-box support for enterprise technologies from:
- IBM – WebSphere MQ, WebSphere MQ Message Broker
- Microsoft – Dynamics CRM, Lync, BizTalk, MSMQ, SharePoint, Azure Service Bus, Exchange Server
- SAP – SAP server, SAP CCMS
- Oracle – Oracle EBS, Siebel CRM, Tuxedo, WebLogic Integration Server
- Apache – Kafka
- VMware – vFabric RabbitMQ
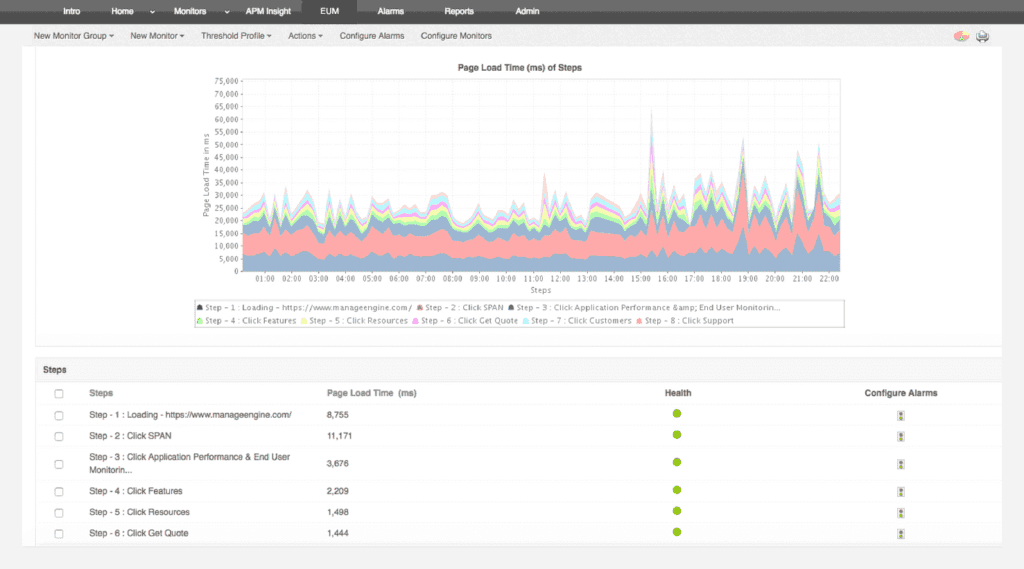
Synthetic application monitoring with a real browser
Measure end-user experience with synthetic transactions
- Simulate business-critical, multi-page workflows via Selenium based scripting of tests.
- Record business-critical transactions using an easy-to-use recorder tool, without scripting, downloadable from within the application monitoring tool.
- Playback recorded transactions at regular time intervals on a real browser, such as Mozilla Firefox, from multiple geographical locations. These locations could be your enterprise branch offices or actual customer locations.
- View response times for all HTML elements in your web page in detailed waterfall charts. Detect components that slow down your web page.
- Get in-depth troubleshooting metrics including screenshots of errors and content checks to see exactly what went wrong.
- Application monitoring software for 24/7 watch of your website to ensure it meets performance SLAs.